Labor Utilization Dashboard
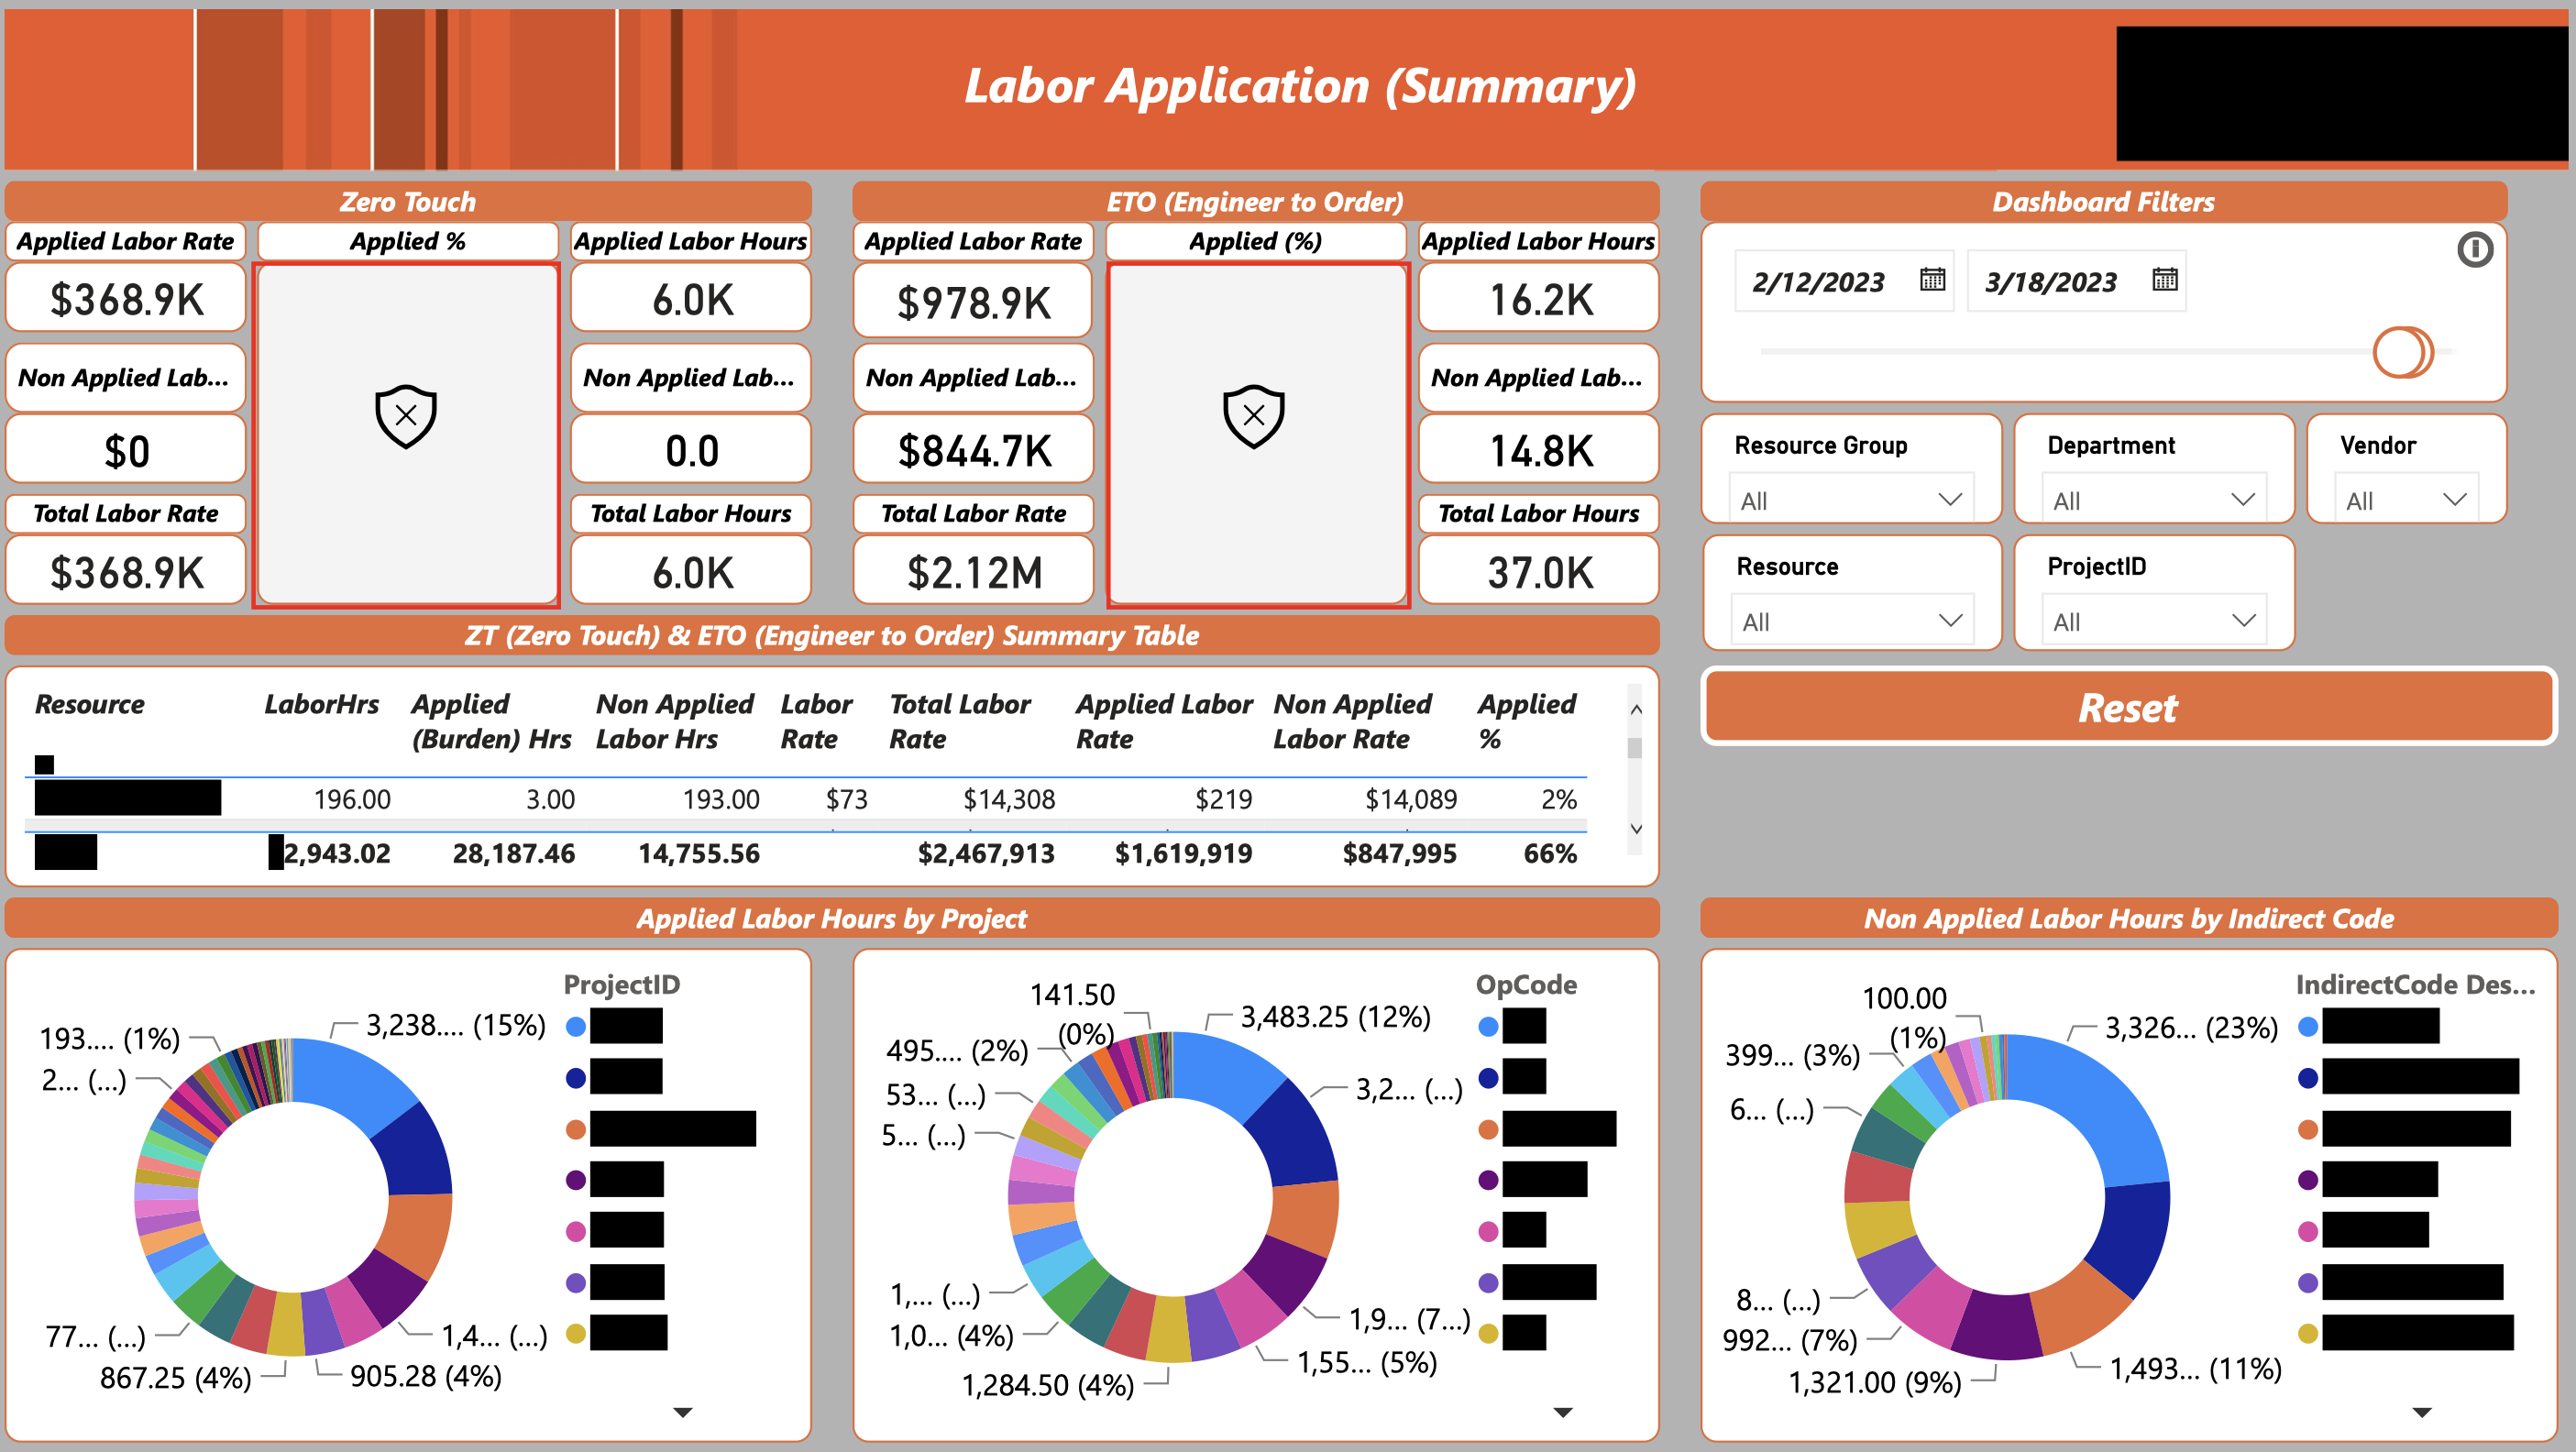
Labor Application Summary
This section provides an overview of labor utilization, including the number of hours worked, productivity levels, labor costs, and overtime expenses. It also details the types of work performed, helping management make informed decisions about staffing and resource allocation.
Insight: High productivity levels are observed in teams involved in project-specific tasks.
Analysis: This information can guide decisions on optimizing workforce allocation and improving productivity.

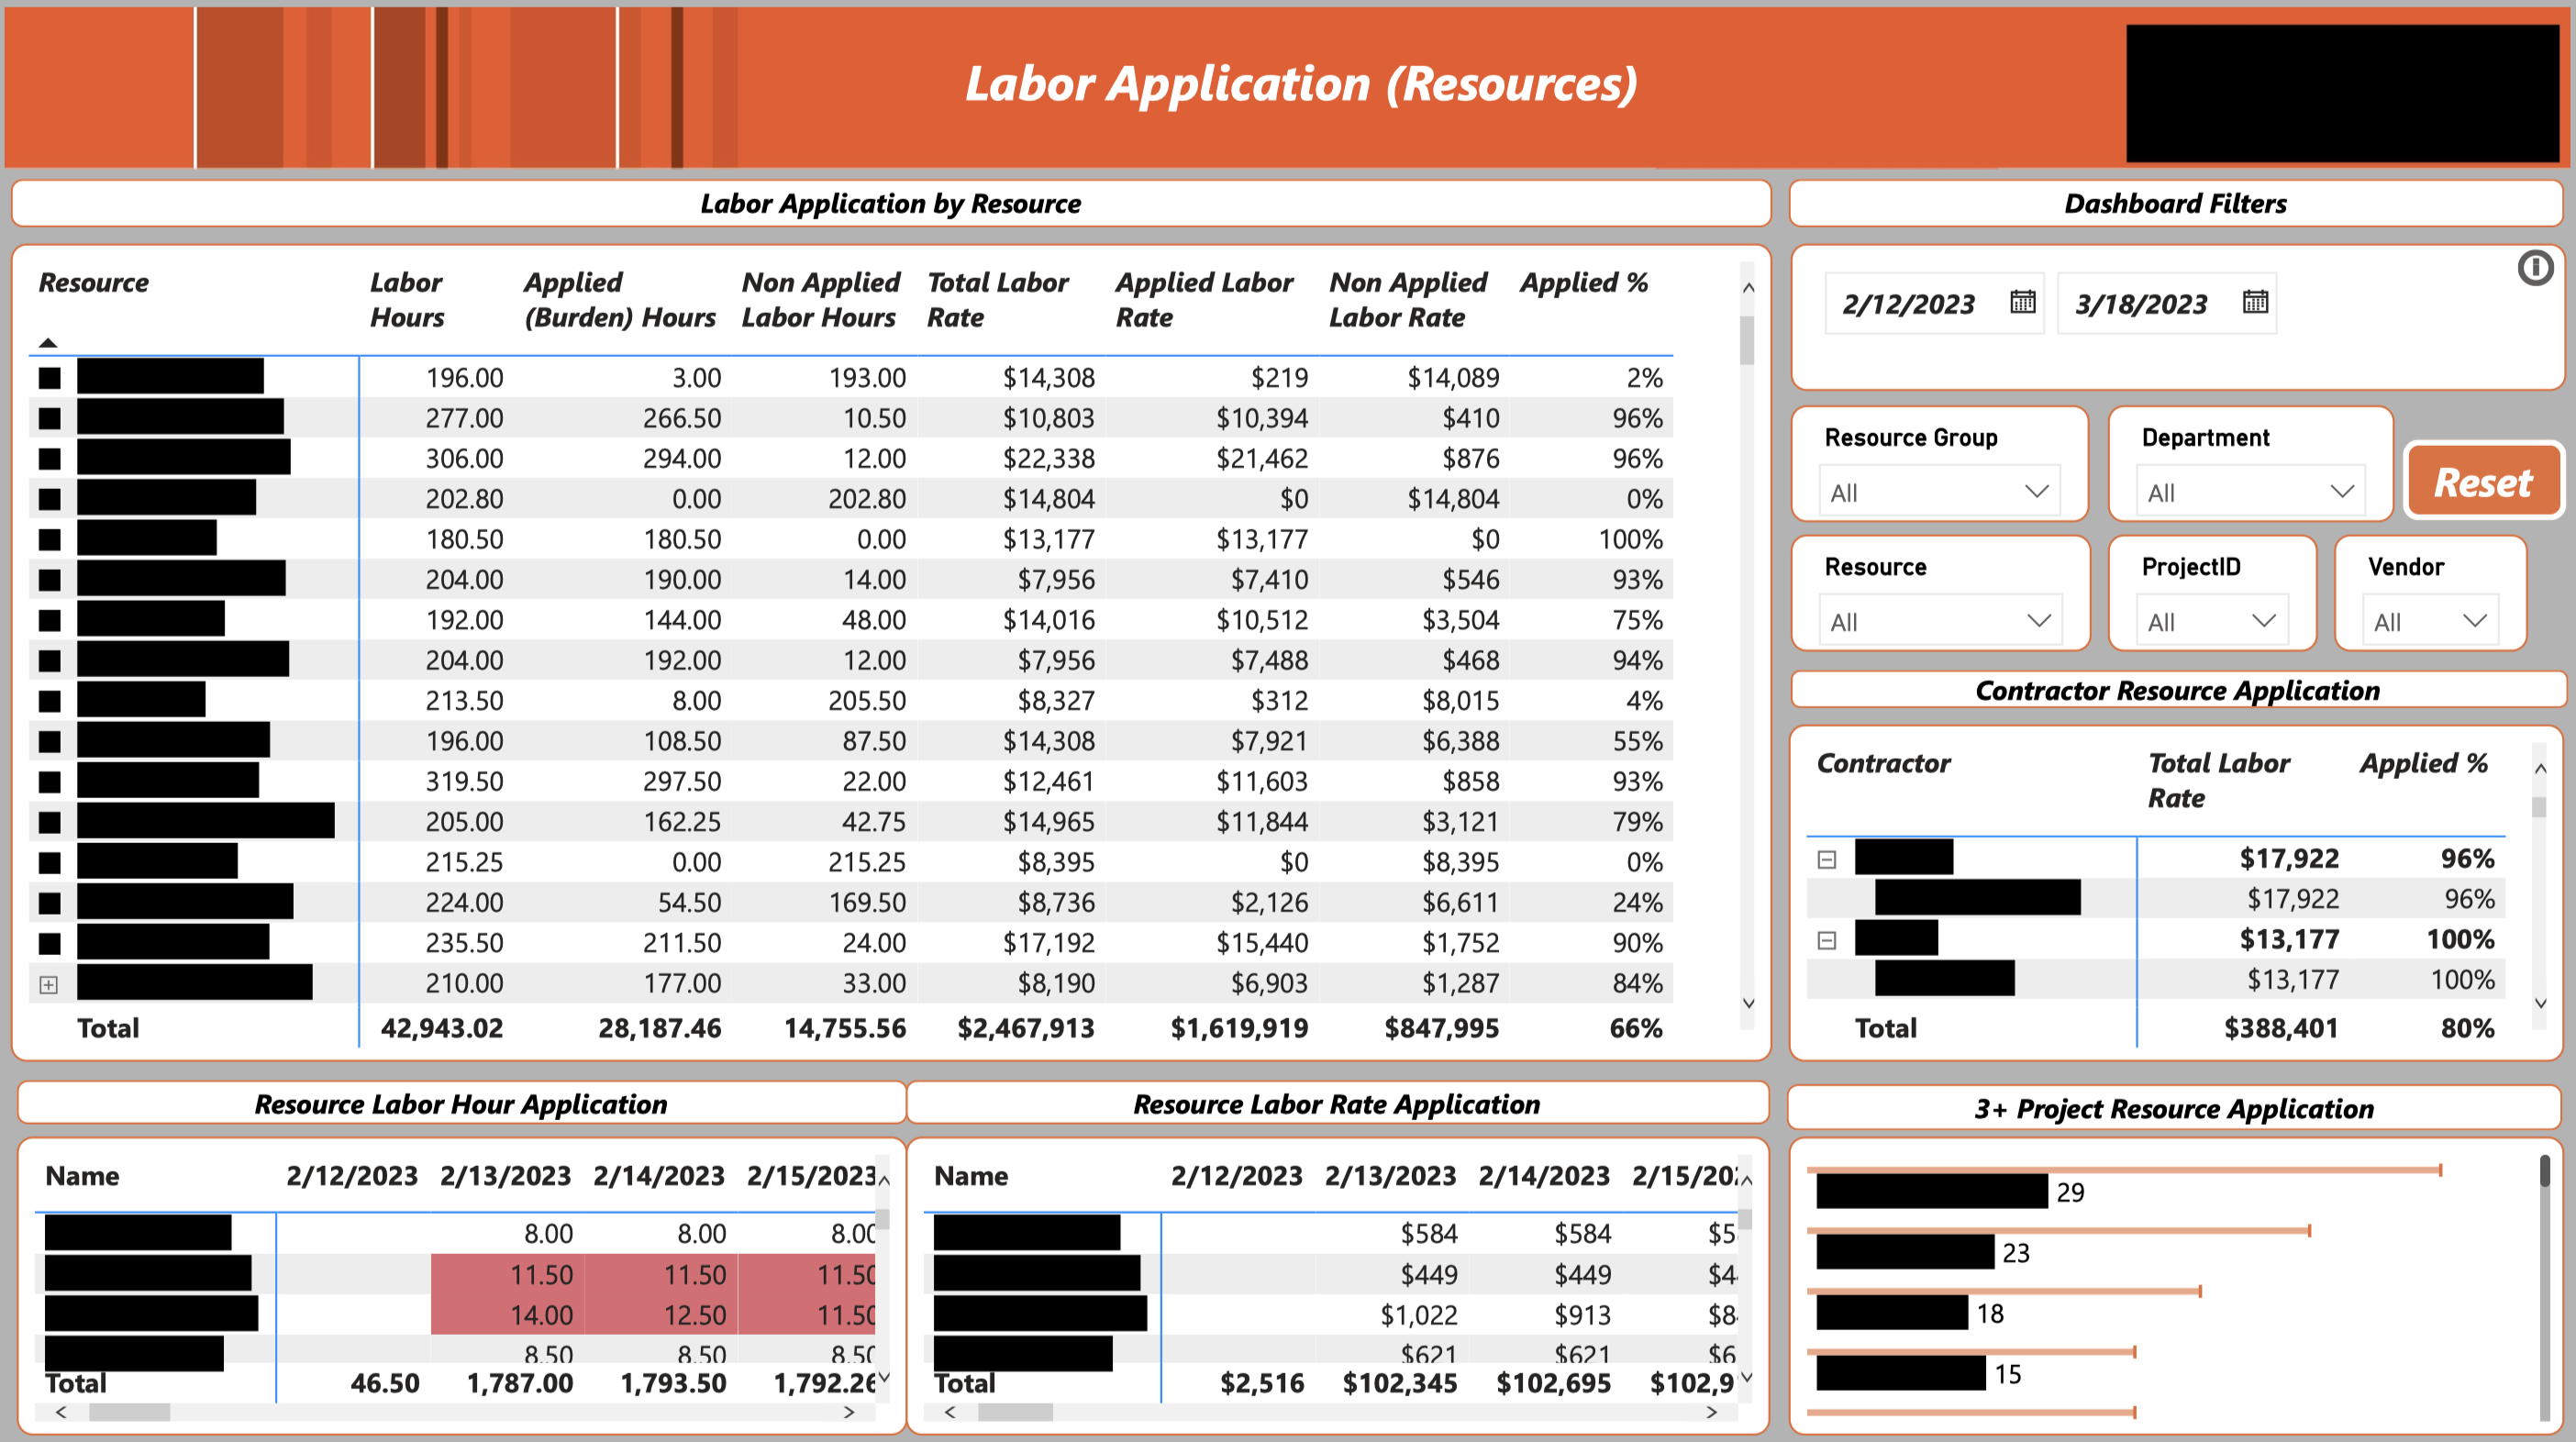
Labor Application Resources
This tab includes detailed resource utilization tables, presenting data on hours worked, productivity levels, labor costs, and overtime expenses.
Insight: Certain projects are consuming more labor hours than planned, impacting overall productivity.
Analysis: Detailed tables help in pinpointing projects that require additional resources or process improvements.

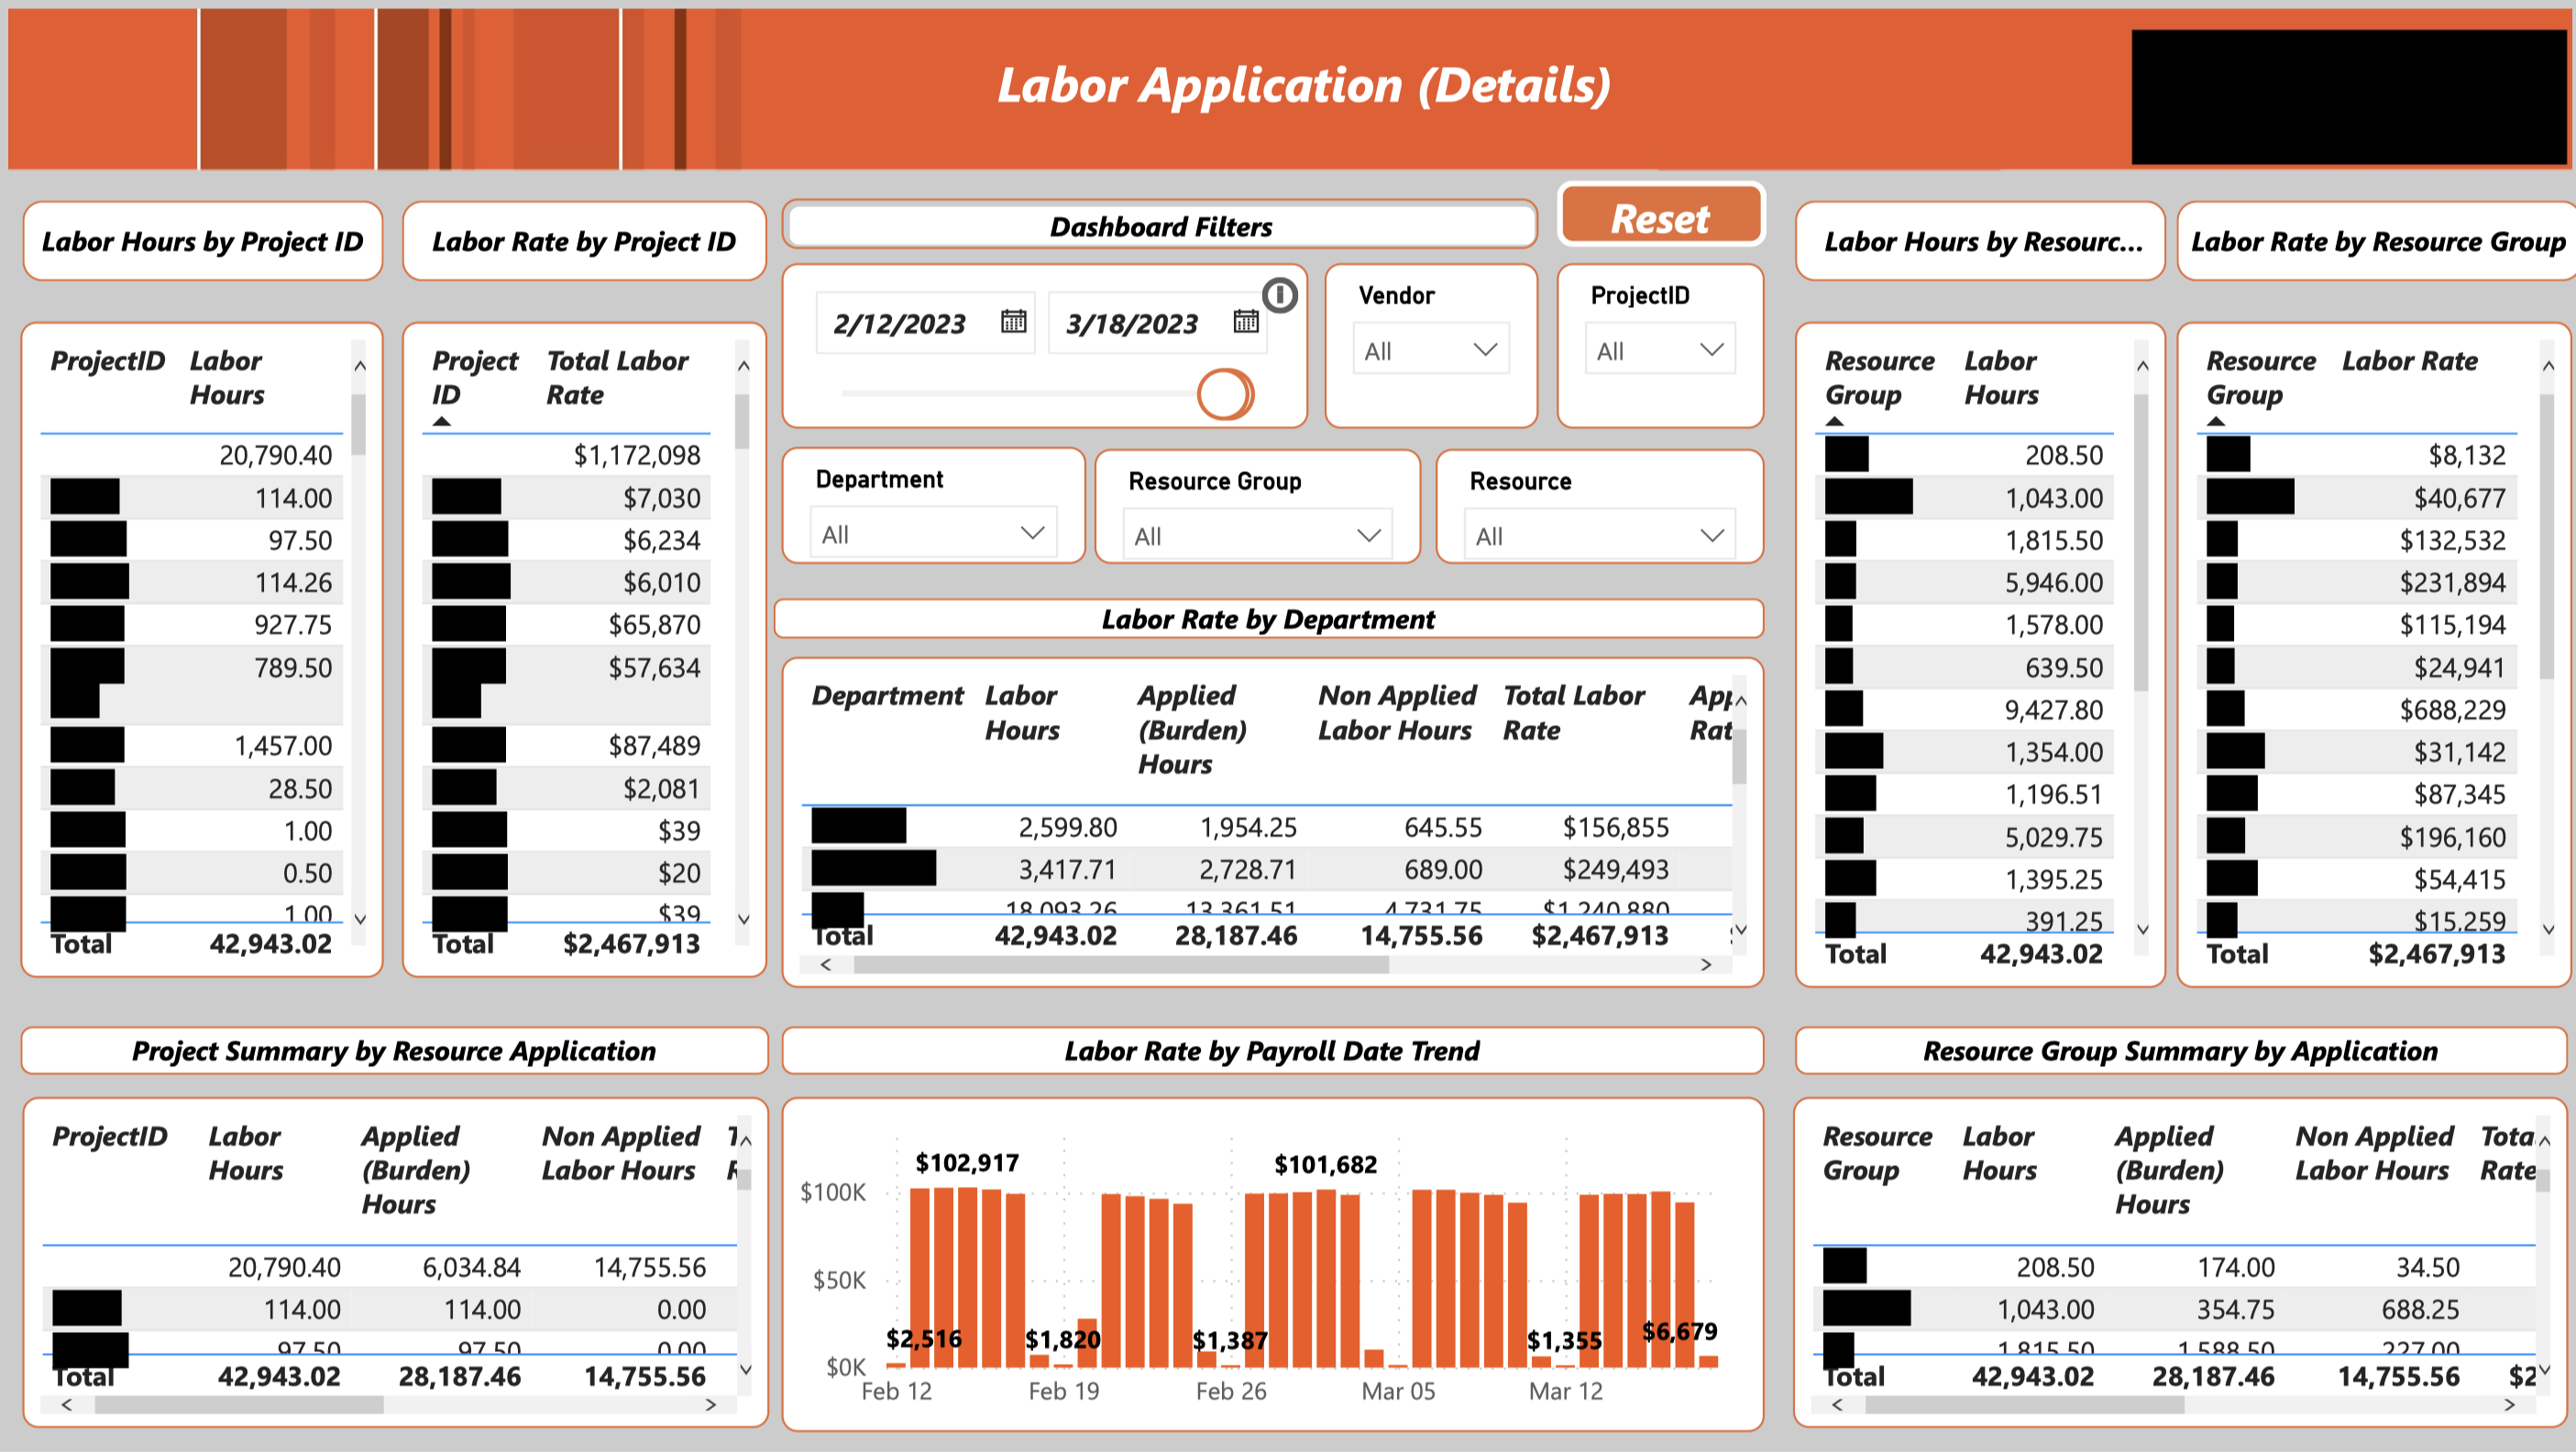
Labor Application Details
This tab provides detailed resource utilization data summarized by Project & Resource Groups, offering insights into labor distribution and effectiveness.
Insight: Resource groups focused on high-impact projects show better utilization rates.
Analysis: Summarized data helps in evaluating the efficiency of resource deployment across various projects.

Conclusion
This Power BI Dashboard is an invaluable tool for managing labor utilization, providing detailed insights that are essential for optimizing workforce efficiency and productivity. The Labor Application Summary section offers a comprehensive overview of labor utilization, including the number of hours worked, productivity levels, labor costs, and overtime expenses. High productivity levels are particularly noted in teams working on project-specific tasks. This information is crucial for guiding decisions on staffing and resource allocation, ensuring that the organization can enhance productivity through strategic workforce management.
In the Labor Application Resources tab, detailed tables present critical data on hours worked, productivity, labor costs, and overtime expenses. Insights from this section reveal that certain projects are consuming more labor hours than initially planned, impacting overall productivity. By pinpointing these projects, management can identify areas that require additional resources or process improvements, facilitating more effective labor utilization.
The Labor Application Details tab provides a granular view of resource utilization data summarized by Project and Resource Groups. It highlights that resource groups focused on high-impact projects demonstrate better utilization rates. This summarized data is instrumental in evaluating the efficiency of resource deployment across various projects, allowing the organization to make informed decisions to optimize labor distribution and effectiveness.
Overall, the detailed visual summaries and insights provided by the Power BI Dashboard enable the organization to monitor labor utilization meticulously, identify trends, and implement data-driven strategies for workforce optimization. This comprehensive approach ensures that labor resources are effectively managed, contributing to improved productivity and operational efficiency